There are two main parts that comprise the JrDebugLogger toolkit, a set of cross-platform header files for adding debug logging support to your code, and a powerful windows program for capturing and displaying logging messages.
To get the maximum use out of JrDebugLogger, you will use a gui tool that knows how to capture and properly display messages that are generated from JrDebugLogger.
The JrDebugLogger files include code that determine if the application is compiled on MS Windows; if so, debug messages are send to the operating system using the DebugOutputString function. DebugOutputString is a function call that can be used in windows applications to broadcast a text message to any debugger applications that are listening for it.
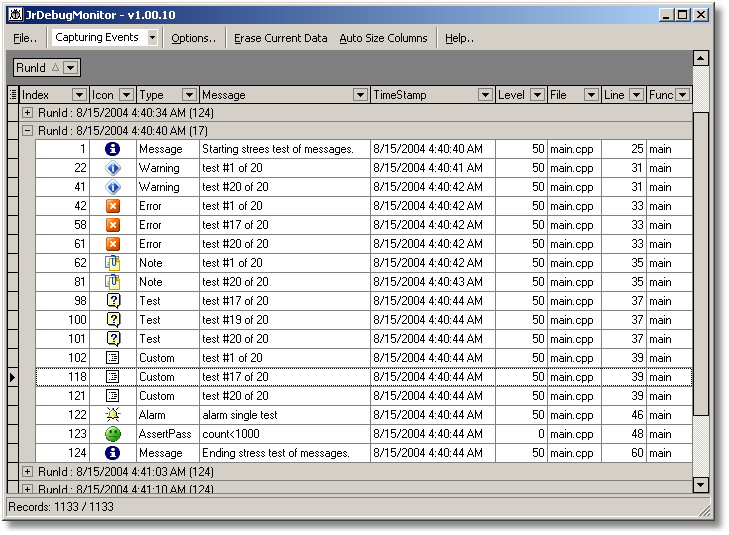
The MS Windows Debug Monitor Viewing gui tool that comes with the JrDebugLogger toolkit lets you capture and view DebugOutputString messages, and can parse the output into columns to make it ideally suited for viewing, searching, sorting, and organizing your logging output.

Start the Debug Monitor Viewer application and then run any program that has been compiled with JrDebugLogger supprt. Any debug messages sent by the program will be captures in the Viewer automatically - there is no need to do anything special. To get the best use out of the viewer, you will want to customize the columns displayed and the grouping of columns.