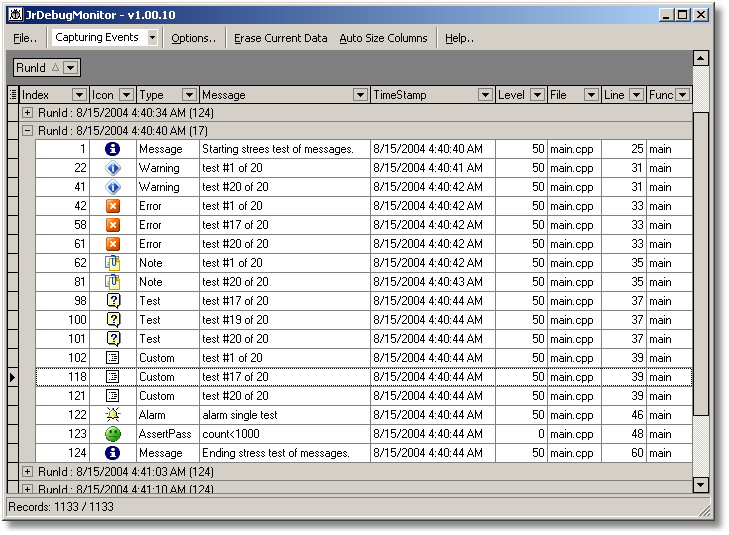
The main interface of the tool:

The key to using the Debug Monitor Viewing tool efficiently is to customize your display to help you focus on the information that is relevant to you.
| • | The first thing you will want to do is disable certain columns that are not useful. You can right click on a column header to select option, including to remove the column (you can always bring it back later). You can also click on the tiny little button to the far left of the columns to quickly enable and disable columns. |
| • | You can drag columns to rearrange the order or change the size. |
| • | You can drag columns to the upper bar to group records - this can be extremely useful in order to group records by the RunId. Group headers show the number of records within the group. |
| • | You can sort by columns by clicking on a blank area of the column. |
| • | Click on the black upsidedown triangle to restrict the view to records with only certain values; a filter will appear at the bottom which you can then customize. |